

Designing for #LetsData Sagemaker Compute Performance

The Problem
#LetsData datasets are Read-Compute-Write and different components often use multi threaded concurrency to achieve efficiency and performance. Most of the time, this internal parallelism does not need to be shared with the customers, but in some scenarios, the system’s internal details are needed so that customers can make an informed scaling decisions.
Sagemaker Compute Engine endpoints (fleets) need to be scaled in accordance with the number of tasks, internal concurrency threads and additional parameters.
This post looks at how concurrency in general is architected for #LetsData and how it can be used to set concurrency configuration that results in adequate performance. For details around the Sagemaker Compute Engine and its design, look at the Sagemaker Compute Engine Launch Announcement[1], Developer docs[2] and Step by Step Examples[3].
Design Assumptions
Lets look at a few assumptions and design issues and then understand the Sagemaker Compute Engine issue.
The Random Distribution Assumption
The concurrent reads, computes and writes are sufficiently randomly distributed so as not to run into pathological issues such as a larger number of requests go to some single server or a subset of servers etc.
The Faster Reads Assumption
Assumption that reads are generally going to be faster than writes - so we will have more data that waiting to be written. The standard pattern for such reader-writer latency mismatch is to use multiple concurrent writers (if possible) for each reader.
Batch Writes and Concurrent Writes
Multiple concurrent writes aren’t possible where records are ordered by some write key (these records need to be written serially) - but in most cases, the random distribution of the records being read leads to performance gains when using concurrent writes.
For example, our write connectors collect documents in buffers and then either:
Use a batch API (Kinesis, SQS)
or do a multi threaded client side batch if a batch API doesn’t exist or isn’t tenable (DynamoDB batch write API doesn’t support conditional checks, SQS batch call limits to 10 messages etc)
Write Performance for AWS Services
While the writes are slower than reads, they are still blazingly fast to cause any perceptible issues in performance.
For example, for services such as DynamoDB, a write takes around 15-20ms on average. Kinesis batched put latency is ~150 ms on average for ~500 records. They still benefit from multi threading in some cases (DynamoDB and SQS for example). In these cases, we allow max 10 threads per writer to write concurrently to the write destinations.
(We assume write destination is adequately scaled.)
The Writer Fanout
The #LetsData dataset’s work is divided into tasks at the time of initialization - where each task could be:
a single file - S3 readers create 1 task for each file
a single shard - Kinesis readers create 1 task per shard
or some fixed slice of the overall work - SQS readers divide the work according to concurrency configuration
Assume we are processing with 10 tasks in a dataset and lambda concurrency is >= 10. This essentially means that we will have 10 tasks reading and writing concurrently to the read and write destination.
If a write destination is DynamoDB or SQS, each of these tasks is then writing with 10 threads concurrently. So your write destination (SQS / DynamoDB) can expect 10 tasks x 10 threads concurrent write requests at any instant in time.
At #LetsData, we’ve mostly taken an experiential approach to deciding the concurrency and threading parameters for different concurrency issues such as the number of writer threads.
We’d initially set a value from what we believe is reasonable, and increase / decrease it based on the results and these rudimentary tests became our informed capacity tests. We didn’t find the need to optimize these with scientifically (mathematically) designed tests since these experience based parameters were mostly working well and further perf optimizations could be deferred to when they would start becoming a perf issue.
This was great until a few weeks ago, when we integrated with Sagemaker Compute Engine and saw latencies that were starkly different from what we had seen.
Compute Workloads
When we integrated with Sagemaker Compute Engine, we were seeing a batch of 5 records latency of 2-3 secs and single call latencies of 500 ms on average.
Compute workloads are different from the traditional read & parse workloads, and this is probably why you see APIs such as InvokeEndpointAsync [4] [5] (for large inputs, inputs and outputs stored in S3) & Batch Transform APIs (asynchronously transform data stored in S3) in the Sagemaker API set. So the on-demand inference API that we are using can be expected to have higher latencies than AWS Service read / write / simple compute latencies.
The Sagemaker InvokeEndpoint (on-demand) API is not batched - so we had to use multi threaded parallel calls to generate the vector embeddings. Since we configure the Sagemaker fleet size, we need to set the number of Sagemaker compute threads accordingly so that they don’t slowdown the Sagemaker fleet (Or conversely, we need to set the Sagemaker fleet size so that the multiple compute threads aren’t causing a performance issue).
Sagemaker Compute Fanout
The Lambda Task Concurrency decides the number of concurrent dataset tasks. For each of these lambda data tasks invocations, we allocate 5 threads (fixed internally in the system) to concurrently call Sagemaker endpoints. Each one of these threads processes a single document that might have multiple elements that need vectorization. If there are two elements that need vectorization (example, vectors for content and vectors for metadata), then we make these two calls in parallel to Sagemaker.
This becomes a fanout as follows:
# of parallel Sagemaker calls = Lambda Task Concurrency x 5 Fixed Internal Threads x min(3, # of vectors per document) Sagemaker Design Issues
We need to be able to answer a few different questions:
How do we decide the Lambda Task Concurrency and the Sagemaker Fleet Size in light of this scaling factor?
Our customers would be setting lambda concurrency and Sagemaker fleet sizes as well, so how do we provide documentation and framework that they can calculate and set these using our guidelines?
This does feel like a possible operation hot area - latency questions and issues will come up again and again around this space. How can we enable our customers so that they have the information that they need to investigate?
We do the following:
Run latency tests for the base unit of work to get a baseline latency profile
Revisit our Queuing System concepts to see how we can use these latency numbers to put reason around what the fleet sizes should be - we make this into workable instructions
We instrument the record as it flows through the system for latency - we capture different latencies and make them available to the customers. We also surface AWS Sagemaker metrics so that customers can self serve investigations.
Sagemaker Latency Profile
To get the baseline latency profile for our Sagemaker Compute Dataset, we run our datasets with Lambda Concurrency 1 (one task is running), Sagemaker Serverless with concurrency of 1 and Sagemaker Provisioned with instance count 1.
Sagemaker Serverless
Our Sagemaker Compute number of threads is still set to 5 - so we’d be sending 5 requests over at any time.
Sagemaker Serverless will process them serially. AWS metrics [6][7] tell us that each request takes around 250ms for model latency and 170 ms for model overhead. We process ~75 requests every minute.

On the client side, we measure the latency of the batch as approximately (model overhead + model latency) x batch_size => (170+250) x 5 ~ 3 secs

What we’ve seen is that the model overhead latency remains constant with Sagemaker Serverless and almost seems like a fixed cost - we tried this setup with 5 Sagemaker Serverless Consistency and 20 Sagemaker Serverless latency - we do see some slight variation in model latency but model overhead remains similar ~ 170ms. We don’t see this overhead with Sagemaker Provisioned, so this seems like an Sagemaker Serverless artifact.
Sagemaker Provisioned
Sagemaker Provisioned instance count is 1 - our Sagemaker Compute number of threads is still set to 5 - so we’d be sending 5 requests over at any time.
Sagemaker Provisioned, since its an EC2 instance processes these in parallel. AWS metrics tell us that each request takes around 280ms for model latency and 5 ms for model overhead. We process ~800 requests every minute.

On the client side, we measure the latency of the batch as approximately (model overhead + model latency) => (5+280) ~ 400 ms
Here are the total times and throughputs for the baseline latency profiles.

Queuing Systems Theory
The Queuing Systems chapter in the book Probability and Statistics for Computer Scientists (2nd Edition) by Michael Baron [8] provides a good refresher on continuous-time queuing process and our current problem can essentially be modeled as one (Book is a recommended read for computer engineers).
We are an essentially M/M/1 queuing process - where the first M is distribution of queue’s inter arrival times, second M is the distribution of the queue’s service times and 1 is the number of servers. M denotes an exponential distribution because it is memoryless and is a Markov process (i.e. present state decides the result, we get no information from the past that can be used to predict the future).
Here is an M/M/1 queueing process cheatsheet and the utilization results for the Sagemaker Serverless and Sagemaker Provisioned setup.

We’ve made some assumptions (model overhead is equal to wait time) and tried to apply this theory to our process. If we go by these numbers, and aim for a target utilization of 70-80%:
1 Sagemaker Serverless Concurrency can support two Dataset tasks (2 lambda concurrency)
1 Sagemaker Provisioned instance can support possibly 4-5 Dataset tasks (maybe more)
With these informed numbers, I’d rerun Sagemaker Serverless with two dataset tasks (lambda concurrency 2) and Sagemaker Provisioned with 5 Dataset tasks (lambda concurrency 5) and recalculate the utilizations and adjust the Lambda Tasks Per Sagemaker Single Unit. I’d then use this Lambda Tasks Per Sagemaker Single Unit metric to decide the Sagemaker fleet size.
For example, if Lambda Tasks Per Sagemaker Single Unit for Sagemaker Serverless is 2 (i.e. 2 Tasks stress the Sagemaker Serverless instance by 80% utilization), and my dataset needs to process 100 tasks, then for 10 Lambda concurrency, maybe 5 Sagemaker concurrency is required. (I’d set this higher though, say to 20, to give some headroom given that the costs might be reasonable).
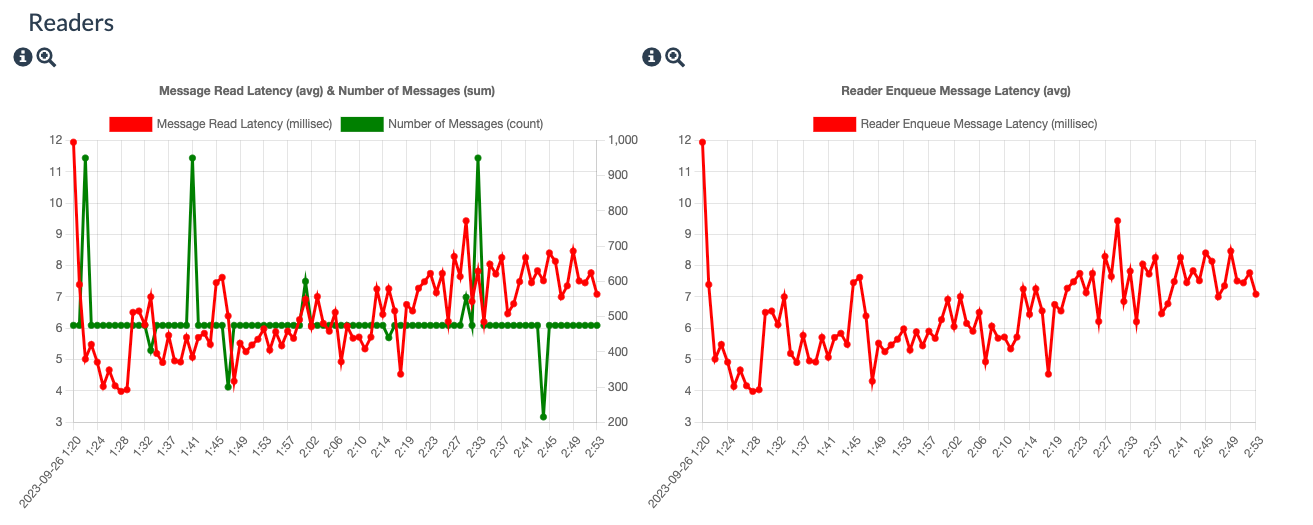
Latency Metrics Dashboard
We’ve added a Task Details Dashboard which measures the latencies of the record as it moves through different subsystems and queues. We’ve gathered metrics such as read time, queue wait times, compute execution times, write times and doc sizes to help with any latency investigations that you may want to do.


Conclusions
We were surprised by the latency issue when we integrated with Sagemaker and that led us into a formal deep dive into how to reason about the queuing systems and decide on the different concurrency configurations. We also instrumented our implementation to allow detailed metrics around record processing.
Approaches that we would like to investigate but did not for this investigation:
benchmarking our model performance and seeing if the ~250-280 ms latency that we are seeing from model execution is reasonable or not
comparing the model execution latencies when its executed in non Sagemaker environments with Sagemaker execution latencies
testing with different models that may be differently computationally intensive and see if the results degrade as expected - for example, running a model that takes 700 ms or larger doc sizes - would the overall system be negatively impacted by such changes?
Thoughts / Comments?
Resources
[1] Launch: AWS Sagemaker available as a Compute Engine on #LetsData
https://blog.letsdata.io/p/launch-aws-sagemaker-available-as
[2] #LetsData Sagemaker Compute Engine Docs: https://www.letsdata.io/docs#computeengine
[3] #LetsData Example - Generate Vector Embeddings Using Lambda and Sagemaker Compute Engine: https://www.letsdata.io/docs#examples
[4] Sagemaker - Different Inference APIs
Real Time Inference: https://docs.aws.amazon.com/sagemaker/latest/dg/realtime-endpoints.html
Async Inference: https://docs.aws.amazon.com/sagemaker/latest/dg/async-inference.html
Batch Transforms: https://docs.aws.amazon.com/sagemaker/latest/dg/batch-transform.html
[5] Sagemaker Async Inference Notebook: https://github.com/aws/amazon-sagemaker-examples/blob/main/async-inference/Async-Inference-Walkthrough.ipynb
[6] How do I troubleshoot latency with my Amazon SageMaker endpoint https://repost.aws/knowledge-center/sagemaker-endpoint-latency
[7] Sagemaker Metrics Docs: https://docs.aws.amazon.com/sagemaker/latest/dg/monitoring-cloudwatch.html
[8] The Queuing Systems chapter in the book Probability and Statistics for Computer Scientists (2nd Edition) by Michael Baron